MLCQ God Class PreTrained Evaluation Models
Comparison Table
| Model |
Accuracy |
Precision |
Recall |
F1-score |
| Logistic Regression |
0.7798 |
0.4864 |
0.5554 |
0.5140 |
| Random Forest |
0.7924 |
0.5148 |
0.5814 |
0.5431 |
| SVM |
0.7831 |
0.4947 |
0.6976 |
0.5751 |
| Decision Tree |
0.7393 |
0.4091 |
0.4938 |
0.4442 |
| Naive Bayes |
0.6737 |
0.3814 |
0.8364 |
0.5208 |
| Gradient Boosting |
0.7845 |
0.4961 |
0.6701 |
0.5674 |
| xgb |
0.7952 |
0.5153 |
0.6022 |
0.5537 |
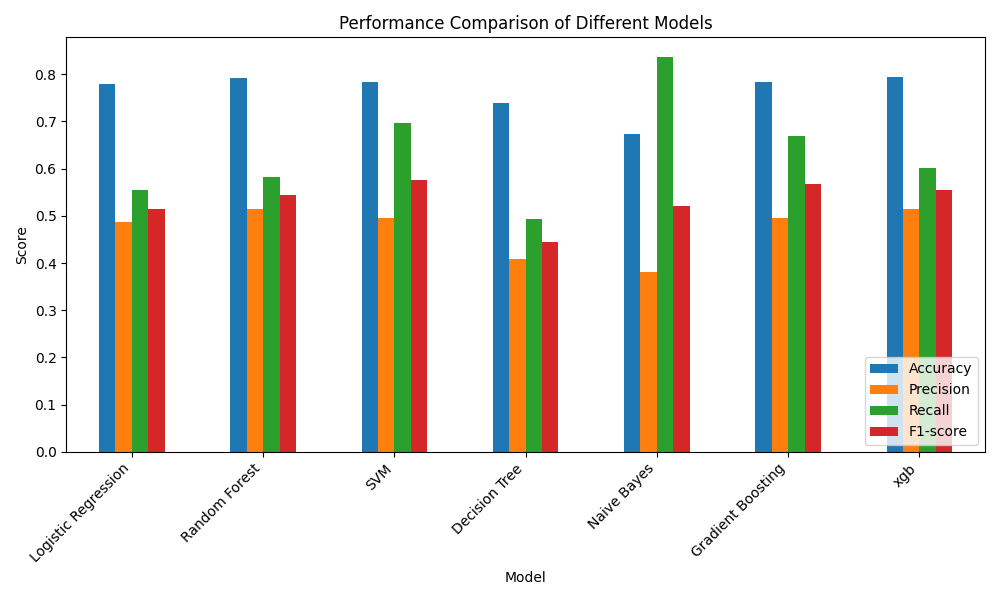
Bar Plot
Evaluation Results
Logistic Regression
- Accuracy: 0.7798
- Precision: 0.4864
- Recall: 0.5554
- F1-score: 0.5140
Random Forest
- Accuracy: 0.7924
- Precision: 0.5148
- Recall: 0.5814
- F1-score: 0.5431
SVM
- Accuracy: 0.7831
- Precision: 0.4947
- Recall: 0.6976
- F1-score: 0.5751
Decision Tree
- Accuracy: 0.7393
- Precision: 0.4091
- Recall: 0.4938
- F1-score: 0.4442
Naive Bayes
- Accuracy: 0.6737
- Precision: 0.3814
- Recall: 0.8364
- F1-score: 0.5208
Gradient Boosting
- Accuracy: 0.7845
- Precision: 0.4961
- Recall: 0.6701
- F1-score: 0.5674
xgb
- Accuracy: 0.7952
- Precision: 0.5153
- Recall: 0.6022
- F1-score: 0.5537